


The India Economic Compass - Monthly Economic and Sectoral Updates (May, 2025)
A monthly wrapper article of all key Economic and Sectoral updates of India.

Welcome to The India Economic Compass, your essential monthly guide to India's dynamic economic and sectoral landscape. At NFPRC, we are dedicated to distilling the most crucial updates into actionable insights, helping you navigate the complexities of India's growth story. Each edition of The India Economic Compass offers a comprehensive snapshot of the nation's performance, covering key economic indicators such as GDP growth, inflation trends, trade dynamics, financial health, fiscal standing, and labor market shifts. Beyond the macro picture, we delve deep into critical sectoral developments across agriculture, fisheries, coal, renewable energy, steel, cement, national roads & highways, and the burgeoning MSME sector. Our detailed annexures provide the granular data and in-depth analysis you need for a truly informed perspective. This tracker is designed to be a valuable resource for businesses, policymakers, investors, and anyone keen on understanding and sharing the latest drivers of India's remarkable economic resilience and strategic trajectory.
The article is divided into 2 sections :
Economic Snapshot - Covering over all key macro indicators of India.
Sectoral Updates - Covering all the key sectoral updates such as Manufacturing, MSMEs and key verticals.
I. Economic Snapshot :
A. Growth and Output :
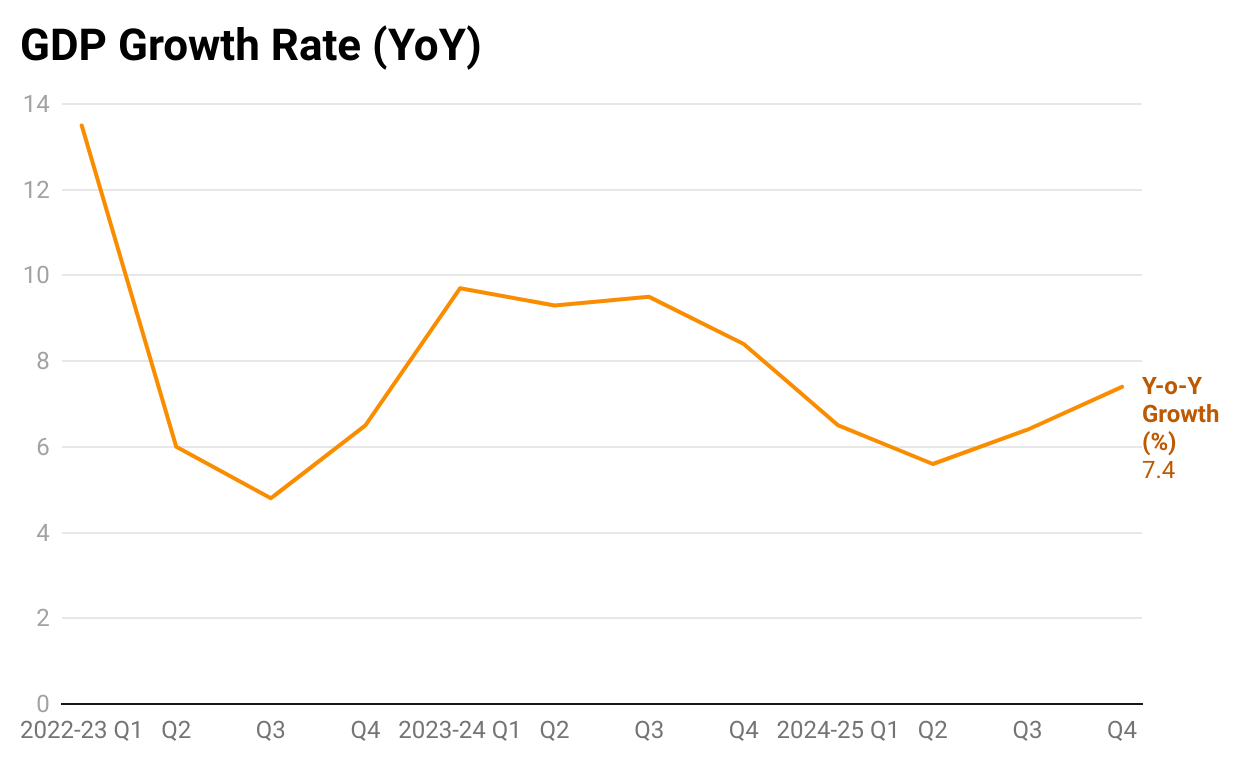
GDP grew at 7.4% in Q4 FY 2024-25, driven by construction (increased by 10.8%) and agriculture (increased by 5%). India's GDP grew 7.4% in Q4, bringing full-year FY 2024-25 growth to 6.5%, the highest among major global economies. In comparison, China grew at 4.7%, the US at 1.8%, the UK at 1.1%, and both Japan and France at just 0.6% according to the IMF's World Economic Outlook 2025. This outperformance signals the strong impact of sustained public infrastructure spending, which is generating high multiplier effects and cushioning the economy against global trade slowdown and geopolitical risks.
B. Inflation and Price :

Consumer Price Index (CPI) cooled to 2.82% (from 4.75% in May 2024), driven by a sharp drop in food inflation to 0.99% (from 8.69% in May 2024). The Wholesale Price Index (WPI) declined to 0.39%.
The decrease in inflation provides the Government with greater fiscal space to continue supply-side investments to improve the economy's long-term efficiency. It also incentivizes the RBI to reduce interest rates to make loans cheaper. Despite headline inflation easing, stable core inflation calls for continued Government focus on structural reforms.
C. Trade and External Sector :
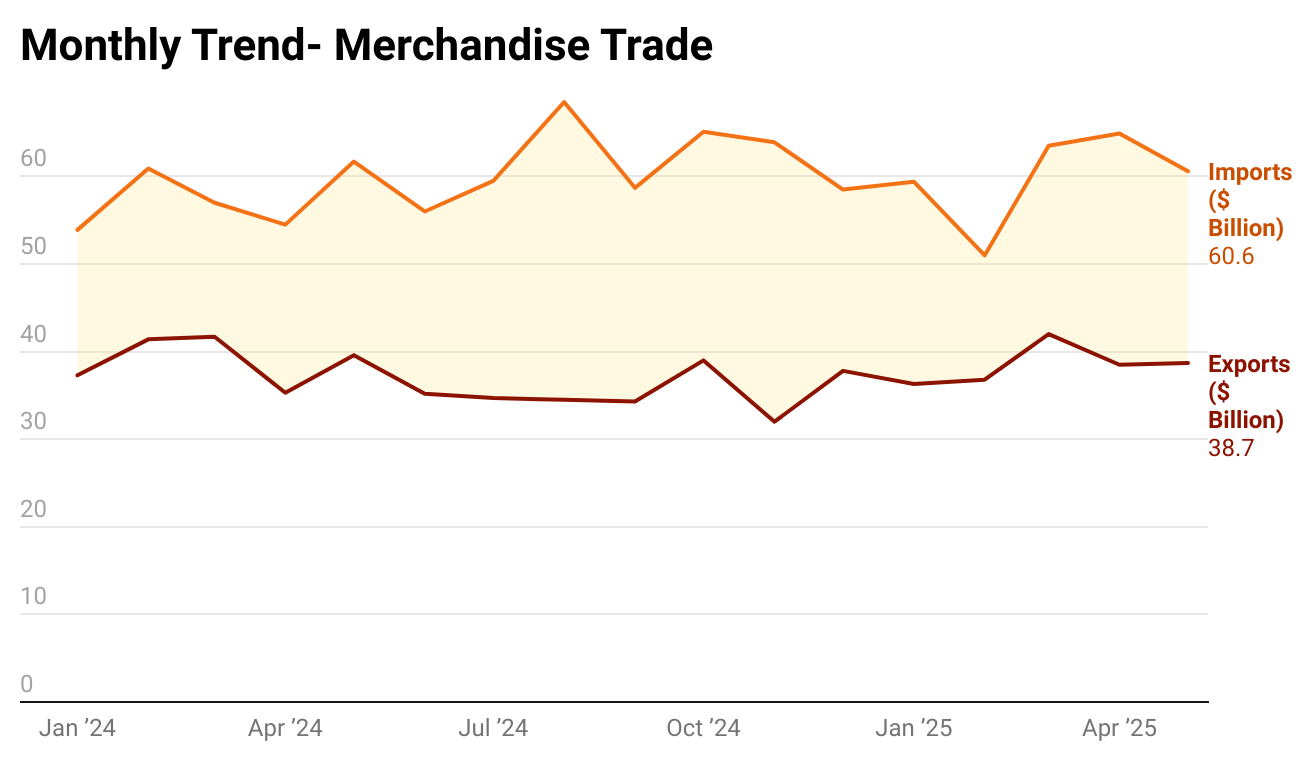
The merchandise trade deficit narrowed to $21.88 billion from $26.42 billion in April. Despite global headwinds, electronic goods, chemicals, and pharmaceuticals exhibited robust annual export growth.
The service sector's performance has been strong, driven by $32.4 billion in exports, which was the primary tailwind in reducing the overall trade deficit to $6.62 billion, a substantial improvement from $9.35 billion in May 2024.

India's total exports (merchandise and services) rose to $71.12 billion in May 2025, up 2.77% from May 2024, reflecting robust growth in services and manufacturing. Imports declined by 1.02% to $77.7 billion. External sector stability can be fortified by leveraging the robust services trade surplus as a key tailwind for Current Account Deficit (CAD) management.
D. Financial Health :
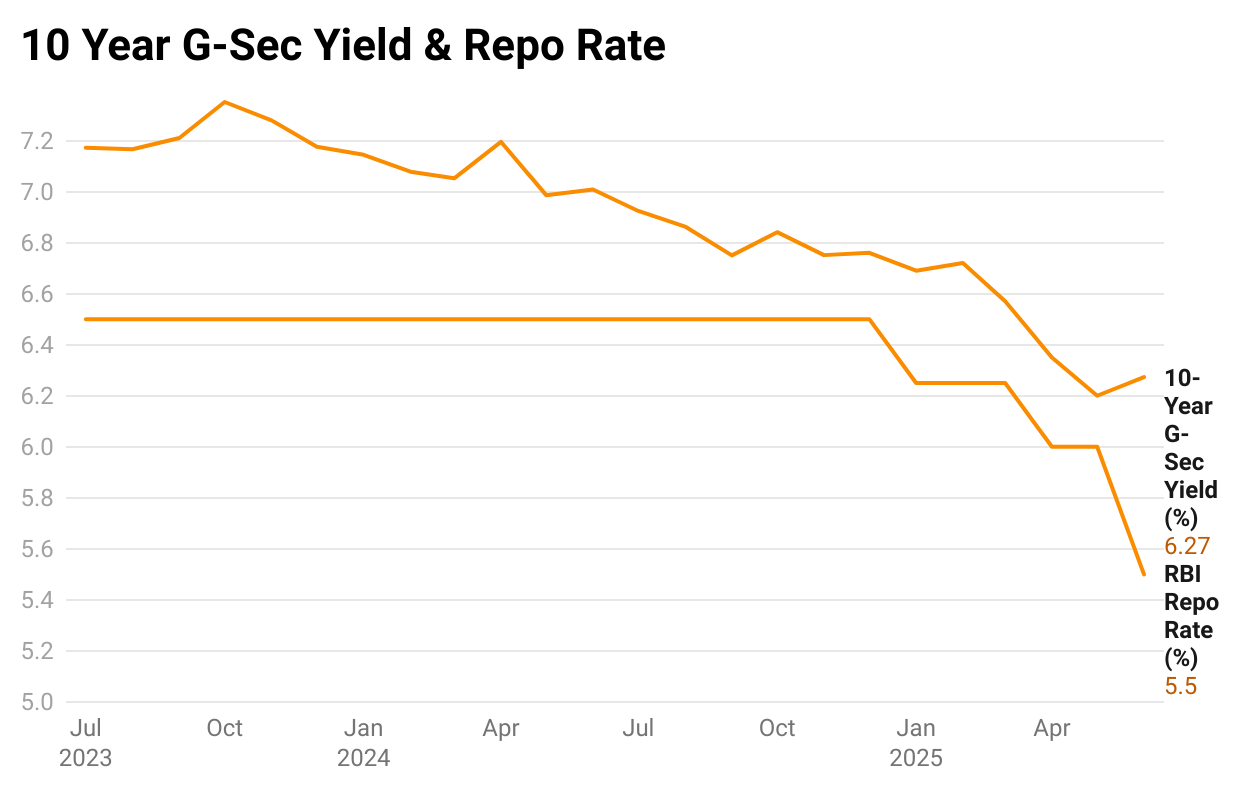
The 10-year G-Sec yield declined steadily from over 7.2% in mid-2023 to 6.27% by mid-2025. The RBI Repo Rate was reduced in phases, reaching 5.5% and signaling an easing monetary policy.
The decline in 10-year G-Sec yields and the RBI's phased reduction of the repo rate to 5.5% signal easier monetary conditions, lowering borrowing costs and boosting credit demand. This stimulates investment and consumption, potentially increasing economic growth but might cause an increase in inflation. In addition, asset prices, particularly of bonds and equities, may rise due to lower yields.
E. Fiscal Health :
GST collections reached ₹2.01 lakh crores in May 2025, a significant 16.4% year-on-year surge.
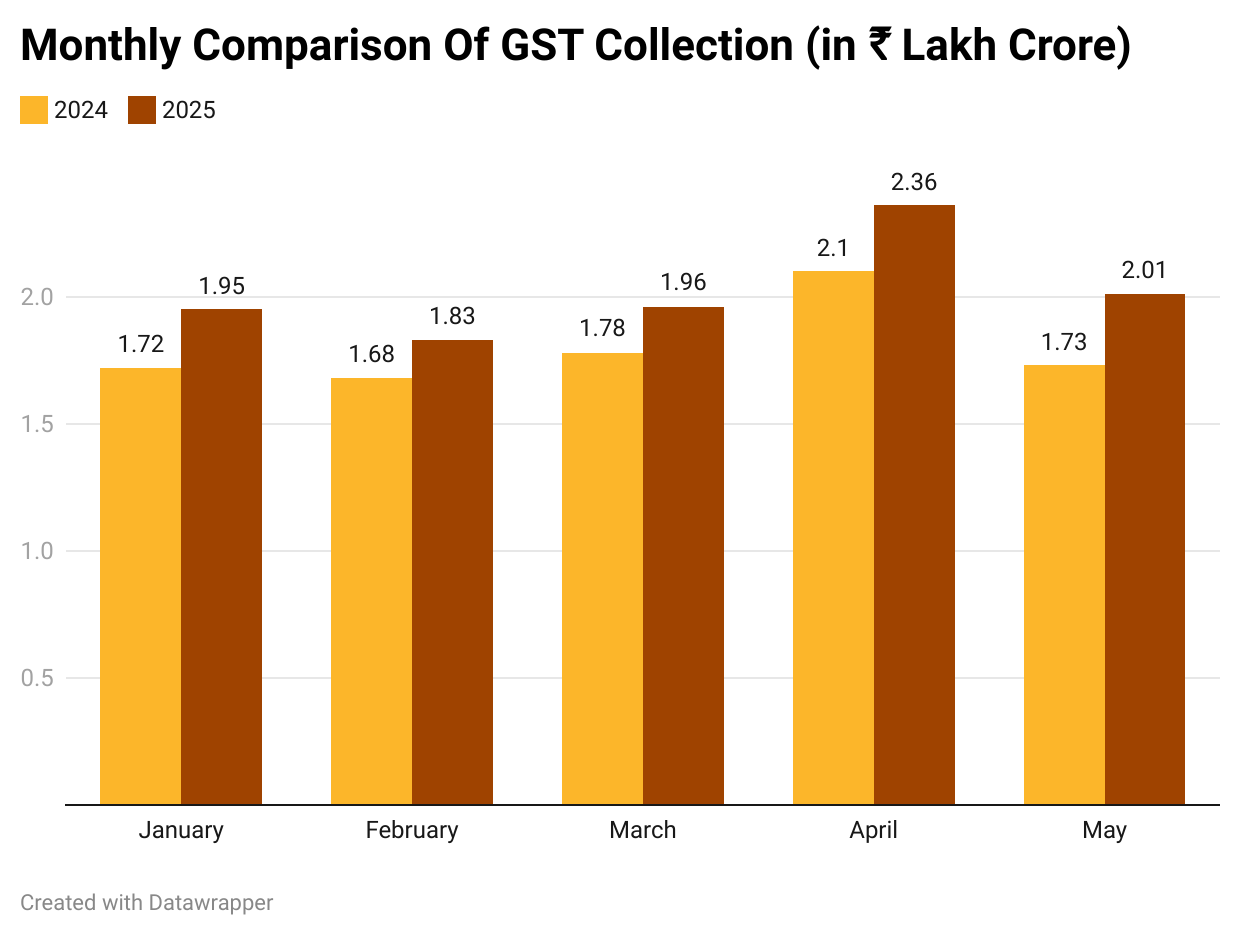
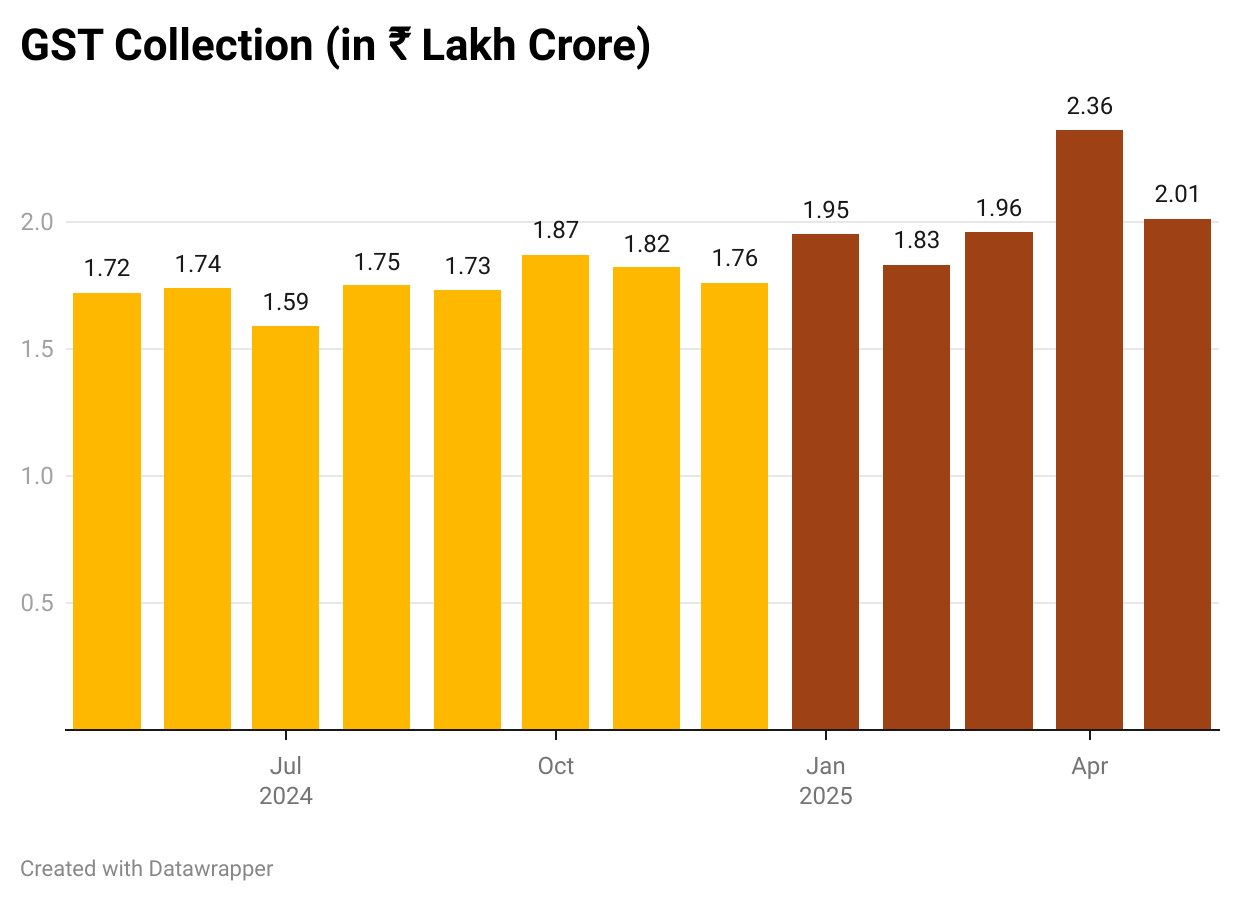
This surge not only reflects rising consumption and better compliance but also gives the Government greater fiscal headroom for capital expenditure. Higher GST inflows can reduce dependence on borrowing, improve investor confidence in public finances, and allow timely payouts to states, enabling smoother execution of welfare and infrastructure schemes.
F. Labour and Employment :

LFPR declined to 54.8%, WPR to 51.7% and UR to 5.6% in May from April. MOSPI launched its first-ever monthly LFPR report in April 2025, previously it released the PLFS reports quarterly.
The observed decline in LFPR, particularly in rural areas, is largely attributable to predictable seasonal patterns. This includes the end of the Rabi harvest, higher summer temperatures limiting outdoor work, and a shift of some unpaid rural helpers towards domestic chores. This seasonal decline, alongside the structural shift in rural employment, underscores the criticality of sustained growth in non-farm sectors.
The next segment covers the sectoral updates digging into the latest data from their respective industries.
II. Sectoral Snapshot -
A. Agriculture:
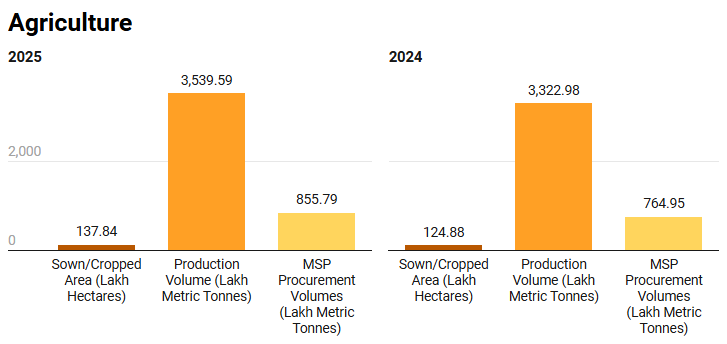
Agricultural production grew by over 216.6 LMT in 2025, with MSP procurement rising to 855.79 LMT, reflecting strong agri-policy impact.
Key Updates:
The Government approved procurement under the Price Support Scheme (PSS) for 54,166 metric tonnes of moong (in Haryana, UP, and Gujarat) and 50,750 metric tonnes of groundnut (in UP) for Summer Crop Season 2025-26.
The Government's increased MSP procurement by over 13%, production increased by 6.5% (200 LMT), and the sown area expanded by 10% (13 lakh hectares) between May 2024 and May 2025 highlights a clear focus on agricultural strengthening.
Implications:
From 2020-21 to 2024-25, MSP increases for Kharif crops, ranging from 30% to 45% for cotton (₹1,606), sesamum (₹2,412) and tur (₹1,550), and the 40% hike for mustard (against an 18% cost increase) demonstrate a targeted effort to incentivize crop diversification toward pulses and oilseeds like moong, urad, and sunflower. These MSP gains of ₹1,000-₹2,000 aim to reduce edible imports of edible oils and pulses. This could prove of critical importance, particularly in states like Madhya Pradesh, Rajasthan, and Gujarat, where oilseeds and pulses are widely cultivated.
B. Fisheries :
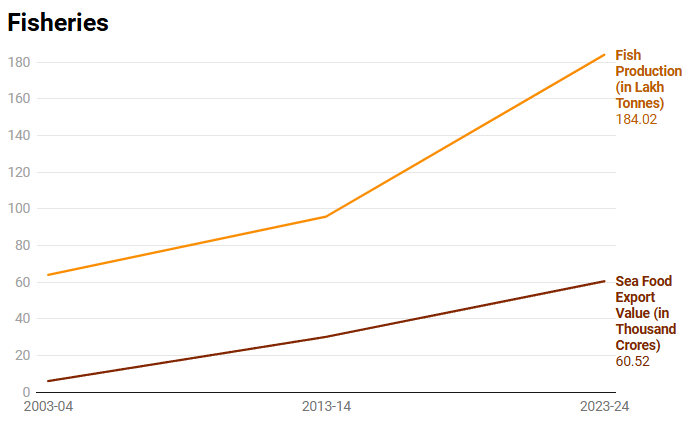
Fish production tripled to 184.02 lakh tonnes, and seafood export value surged to ₹60,520 crore in 2023-24, highlighting sectoral transformation.
Key Updates:
Fish production has grown by an impressive 104%, increasing from 95.79 lakh tonnes in FY 2013-14 to 195 lakh tonnes in FY 2024-25. India today stands as the world's second-largest fish-producing country, with 8% share in global production.
The inland fisheries sector has recorded a remarkable 140% growth, with production rising to 147.37 lakh tonnes in FY 2024-25. Inland fisheries now contribute approximately 75% of the country's total fish production, which stands at 195 lakh tonnes for the fiscal year.
Implications:
With increased production, India now accounts for 8% of global fish output, emerging as a significant player in the international fisheries value chain. However, its presence in premium export markets, especially in seafood and value-added fish products, remains limited. Tapping into these high-value segments is essential not only to boost export earnings but also to translate production gains into strategic influence during global trade negotiations and market access discussions.
The rapid growth of inland fisheries, now accounting for 75% of total fish production, marks a strategic achievement. In contrast, the marine fishing sector faces significant challenges due to WTO regulations. According to WTO expert Abhijit Das, these rules reflect a structural bias: developed countries can readily comply with sustainability requirements due to existing documentation systems, while developing nations like India face complex compliance hurdles, despite not engaging in unsustainable fishing. This disparity hinders their ability to expand marine operations, even as traditional subsidizers such as China, the EU, and the US retain their industrial edge.
Pradhan Mantri Matsya Sampada Yojana, one of the flagship schemes of the government, has given a major boost to Inland fisheries, particularly benefiting the northeastern states. To fully capitalize on this surge, post-harvest infrastructure needs to be strengthened to ensure farmers can access premium markets for their increased output.
C. Coal :
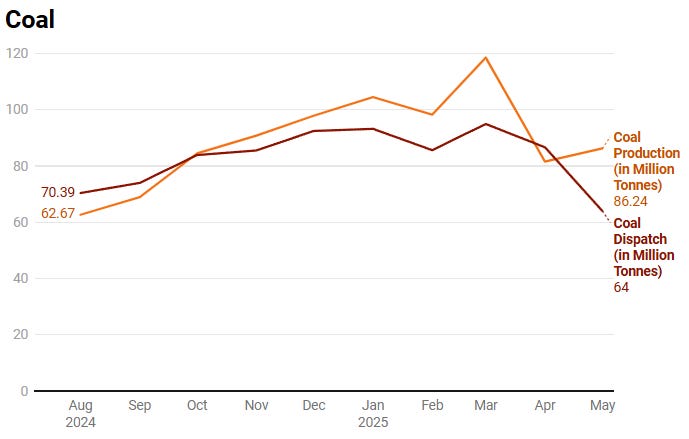
Coal output touched 86.24 MT in May 2025, maintaining strong supply.
Key Updates:
The total coal stock maintained by various coal companies reached 122.7 million tonnes (MT) as of May 31, 2025. This figure represents a substantial increase of 29.2% when compared to the 94.98 MT recorded during the same period in the previous year.
A total of 86.24 million tonnes (MT) of coal was produced in May 2025 from Captive and Commercial Mines, which represents a significant year-on-year growth of 24.57% compared to May 2024.
A total of 17.5 million tonnes (MT) of coal was dispatched from Captive and Commercial Mines in May 2025, surpassing last year's dispatch of May 2024. This marks a 13.8% increase compared to May 2024.
Implications:
The increase in coal stock and production indicates the critical role of coal in maintaining a reliable power supply during peak demand and renewable intermittency, safeguarding households and industries. For instance, in June 2024, amid a record-breaking heatwave pushing electricity demand to 250 GW, coal power plants supplied over 73% of electricity, ensuring grid stability under extreme pressure. Similarly, in May 2025, coal plants ramped up output by 35–40 GW within two hours after sunset, compensating for the sharp drop in solar power.
Between April 2024 and February 2025, coal imports fell by 9.2% to 220.3 MT, saving $6.93 billion (₹53,137 crore) in foreign exchange. Imports for thermal power blending dropped sharply by 38.8%, despite a 2.87% rise in coal-based power generation and reducing dependency on countries such as Indonesia and Australia for imports.
D. Renewable Energy :
Total solar capacity surged to 110,834 MW in May 2025 (up from 84,277 MW), leading a broader renewable energy growth driven by gains in wind (+4,869 MW) and hydro sectors.

Key Updates:
Renewable Energy Takes A Lead In Increased Power Generation additions are estimated to offset around 44 million tonnes of CO₂ annually, equivalent to emissions by 9 million cars each year.
In FY 2024-25, the growth in domestic renewable generation led to a reduction of nearly 18 million tonnes in thermal coal imports, easing pressure on foreign exchange reserves and improving energy trade balance. Solar and wind power generation met over 19% of daytime demand in high-radiation months, reducing reliance on imported oil-based peaker plants and contributing to more stable grid costs.
E. Steel :
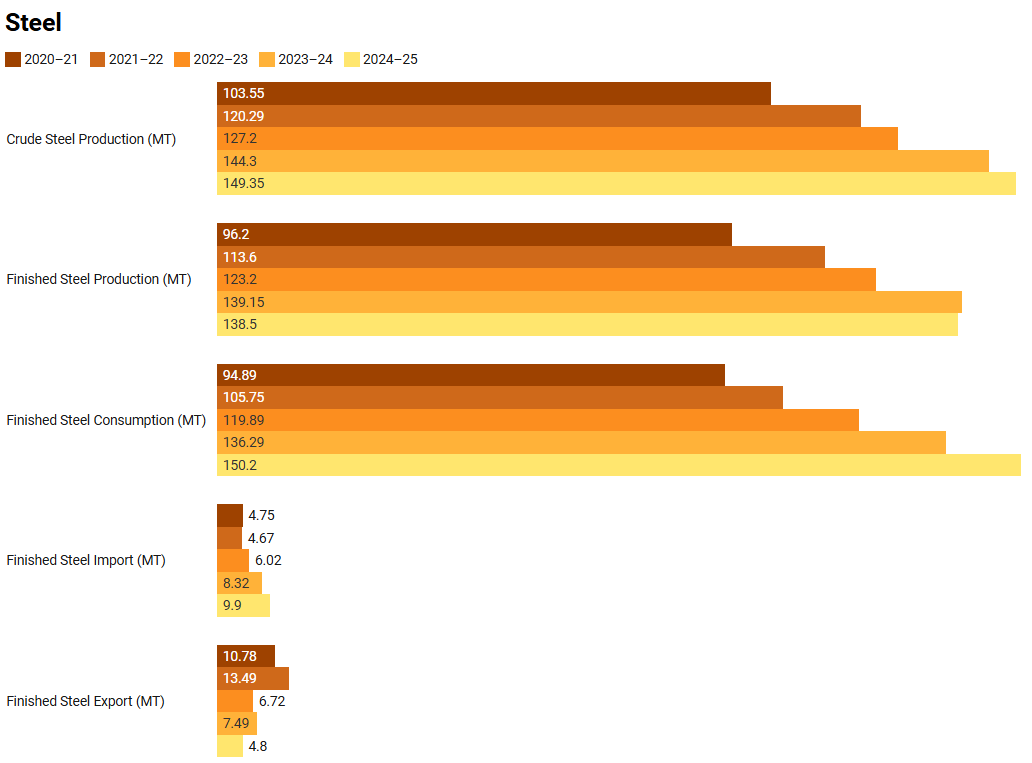
India reached record highs in steel metrics with 149.35 MT crude steel production, 138.5 MT finished steel output and 150.2 MT domestic consumption in 2024–25.
Key Updates:
Crude steel production reached 149.35 MT in 2024–25, rising from 144.30 MT in 2023–24 and 103.55 MT in 2020–21, a 44% increase in four years. Finished steel production reached 138.5 MT, compared to 139.15 MT in 2023–24. Meanwhile, finished steel consumption is expected to reach 150.2 MT, up from 136.29 MT the previous year and 94.89 MT in 2020–21.
An estimated 9.90 million tonnes of finished steel was imported in FY 2024-25, a 38% increase YoY, primarily due to demand for high-grade flat steel and electrical steel. Despite U.S. steel tariffs being in place since 2018, export declines in FY 2024–25 were sharper due to expanded tariff coverage (up to 50%) on more Indian products like auto parts and appliances. Combined with rising protectionism in the EU and Southeast Asia, our finished steel exports fell to 4.8 MT, down sharply from previous years.
Implications:
The supply gap, with crude steel at 149.35 MT and finished steel at 138.5 MT against 150.2 MT consumption, may initially raise steel prices, potentially slowing industrial growth and increasing costs for downstream sectors like automotive and construction over time.
The import surge of high-grade steel.
F. Cement :

Key Updates:
Cement Production stood at 38.54 MMT in May 2025, an increase from 36.4 MMT in May 2024. For FY 2025-26, the industry is projected to grow by 6-7% in volume with production reaching 480 MT, driven by strong real estate activity and a record ₹11.2 lakh crore infrastructure outlay by the government.
Currently, cement production capacity stands at around 600 MTPA, with projections to reach 850 MTPA by 2030. In FY 2022-23, the country produced 374.55 MMT of cement, and the sector is expected to grow at a 4.7% CAGR, potentially touching 5.99 billion tonnes by FY 2031-32.
Implications:
Cement production rose to 414 MT in FY 2024–25, up from 391 MT in FY 2023-24, driven by sustained infrastructure demand. The Government’s facilitation of over $7.91 billion in FDI into the cement and gypsum sector (cumulative till FY 2024-25) has supported capacity expansion, especially by players like UltraTech, Shree Cement and Adani Cement.
Alongside capacity growth.
G. National Roads & Highways :
Key Updates:
Between April and May 2025, major projects like the Shillong–Silchar NH-06 upgrade (166.8 km, ₹22,864 crore) and the Zirakpur Bypass (19.2 km, ₹1,878 crore) were approved. The Guntur–Hyderabad NH section (49 km) began its four-lane expansion in May.
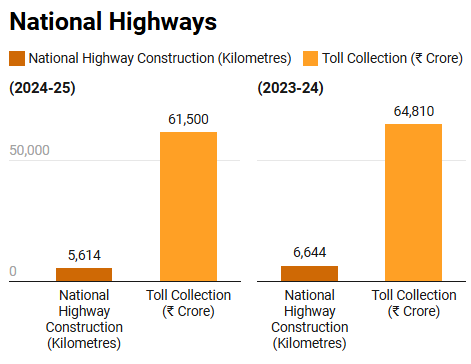
The national highway network has grown to 1,46,204 km as of March 2025. The average construction pace has nearly tripled, rising from 11.6 km/day (2013–14) to over 34 km/day (2023–24). In FY 2023–24 alone, 6,644 km of highways were built, with 5,614 km targeted for the following year.
Implications:
The road project awards under the Bharatmala programme slowed down in 2024-25. The slowdown in construction is attributed to execution challenges and significant delays in the receipt of appointed dates after project awards. NHAI did expedite spending in the second half of FY 2024-25. NHAI needs to project award processes, alongside strengthening on-site quality control and dispute resolution.
III. Annexure I - Economic Updates In Detail -
This section brings you the detailed data insights on the previously discussed Economic Updates. Read ahead for comprehensive updates encapsulated in tables and key takeaways.
A. Growth and Output :
Key Highlights:
Robust GDP Expansion: GDP growth rose to 7.4% in Q4 FY 2024–25, led by construction (increased by 10.8%) and agriculture (increased by 5%), reflecting strong infrastructure and rural demand.
Strong Business Activity (PMIs): Manufacturing PMI remained robust at 57.6 in May 2025, and Services PMI stood strong at 58.8 in May 2025, consistently indicating healthy expansion and strong demand across both sectors.
Steady Industrial Production: While IIP growth moderated to 2.7% in May 2025 from 3.0% in April 2025, it still reflects consistent industrial output.
Strong Investment & Demand: Robust Gross Fixed Capital Formation (GFCF) and private consumption continue to drive demand.
B. Inflation and Price :
Key Highlights:
Lowest CPI since February 2019: Consumer Price Index (CPI) inflation significantly cooled to 2.82% in May 2025, marking its lowest level since February 2019. This is a substantial improvement from 3.16% in April 2025 and a sharp decline from 4.75% in May 2024, demonstrating the Government's successful efforts in price stability.
Drop in Food Prices: Food inflation plunged to an impressive 0.99% in May 2025, a stark contrast to 1.78% in April 2025 and a significant decline from 8.69% in May 2024.
Wholesale Price Stabilisation: Wholesale Price Index (WPI) inflation reached a 14-month low of 0.39% in May 2025, further declining from 0.85% in April 2025 and 2.61% in May 2024. This broad-based moderation, driven by easing prices in food, fuel, and manufacturing, signals reduced input costs for businesses and a healthier production environment.
Contained Core Inflation: Core inflation remained stable at 4.30% in May 2025 (compared to approximately 4.0% in April 2025 and 4.08% in May 2024), demonstrating that underlying price pressures remain well within manageable limits. This provides the Reserve Bank of India with greater flexibility for pro-growth monetary policies.
C. Trade and External Sector :
Key Highlights:
Overall External Performance Improves: The total exports registered a 2.77% year-on-year growth, reaching $ 71.12 billion in May 2025. Concurrently, total imports moderated to $ 77.75 billion, reflecting a judicious approach to external demand management and contributing to a healthier external balance.
Services Trade Surplus Bolsters External Accounts: A robust services trade surplus of an estimated $ 14.65 billion in May 2025 significantly cushioned the merchandise trade deficit, which narrowed to $ 21.88 billion from $ 26.42 billion in April. This strong services performance, driven by $ 32.39 billion in exports, was the primary tailwind in reducing the overall trade deficit (merchandise and services combined) to $ 6.62 billion, a substantial improvement from $ 9.35 billion in May 2024.
Key Export Sectors Maintain Momentum: Despite global headwinds, electronic goods, chemicals, and pharmaceuticals exhibited robust year-on-year export growth, highlighting the growing competitiveness and diversification of our manufacturing export base.
D. Financial Health :
Key Highlights:
Proactive Monetary Easing: The RBI's 50 bps repo rate cut, its third consecutive reduction, coupled with the 100 bps CRR cut, demonstrates a decisive monetary policy push to front-load liquidity and reduce the cost of capital, aiming to stimulate economic activity and ensure smoother credit transmission.
Systemic Financial Stability: Despite a moderation in bank credit growth to ~9% YoY, healthy deposit growth and a decline in 10-Year G-Sec Yields underscore a stable and well-capitalised financial system that is prudently managing asset quality and absorbing regulatory shifts, enabling ample market liquidity for future economic needs.
Flexible Policy Calibration: The strategic shift in the RBI's policy stance to "Neutral" from "Accommodative" signifies a judicious approach, reflecting the central bank's readiness to calibrate future monetary actions based on evolving macroeconomic conditions and global uncertainties, ensuring both growth support and inflation management.
E. Fiscal Health :
Key Highlights:
Robust Economic Activity Reflected in Collections: The significant 16.4% year-on-year surge in May 2025 GST collections to ₹ 2.01 lakh crore underscores robust economic momentum and enhanced formalisation, reflecting a widening tax base and effective compliance mechanisms.
Fiscal Prudence Evident: FY 2024-25 & FY 2025-26 Trajectory: The Central Government effectively contained the FY 2024-25 fiscal deficit at 4.8% of GDP, showcasing strong fiscal discipline. This positive momentum, driven by strategic capital expenditure and record RBI dividends, underpins the robust commitment to the 4.4% FY 2025-26 target.
Resilient Gross Revenue Momentum: Despite a marginal -1.39% decline in Net Direct Tax Collections to ₹ 4.59 lakh crore (April 1 - June 19, FY 2025-26) due to a robust 58% increase in refunds, Gross Direct Tax Collections have demonstrated underlying economic strength with a 4.86% growth.
F. Labour and Employment Indicators :
Key Highlights:
Decline in Labour Force Participation Rate (LFPR): The observed decline in LFPR to 54.8%, WPR to 51.7% and UR to 5.6% in May from April, particularly in rural areas, is largely attributable to predictable seasonal patterns. The end of the Rabi harvest, higher summer temperatures limiting outdoor work, and a shift of some unpaid rural helpers towards domestic chores, align with expected fluctuations in the new monthly PLFS series.
Structural Reorientation of Rural Employment: The share of employment in the primary (agriculture) sector decreased from 45.9% in April to 43.5% in May. This indicates a positive and ongoing absorption of labour into the more productive secondary and services sectors within rural areas, signalling a maturing rural economic structure.
Formal Sector Expanded: EPFO data for April 2025 shows a net addition of 19.14 lakh members, reflecting a 31.31% increase over March 2025 and a 1.17% year-on-year growth compared to April 2024. This growth, coupled with a 5-month high in fresh formal hiring, notably driven by the 18−25 age group (57.67%) and increased female participation.
IV. Annexure II - Sectoral Updates
This section brings you the detailed data insights on the previously discussed Sectoral Updates. Read ahead for comprehensive updates encapsulated in tables and key takeaways.
A. Agriculture & Allied :
Agriculture -
Key Highlights:
Improved Agricultural Output: The sown area increased to 137.84 lakh hectares in 2025 (from 124.88 lakh hectares in 2024), while production rose to 3539.59 lakh metric tonnes in 2024–25 (up from 3322.98 in 2023–24). MSP procurement volumes also grew to 855.79 lakh metric tonnes, reflecting better harvests and procurement support.
Decline in Agri Credit Disbursement: Despite higher output, agriculture credit disbursed declined to ₹ 19.28 lakh crore in 2024–25 from ₹ 25.48 lakh crore in 2023–24, indicating tighter financing or improved credit efficiency.
Fisheries and Animal Husbandry -
Key Highlights:
Steady Growth in Animal and Marine Output: Fish production rose to 195 lakh tonnes in 2024–25 (up from 184 lakh tonnes in 2023-24), while milk production reached 2528.3 lakh tonnes (up from 2392 lakh tonnes in 2023-24), and egg production climbed to 14,750 crore (up from 14,277 crore in 2023-24), indicating consistent growth across key protein sectors.
Marginal Rise in Marine Exports: The export value of marine products saw a modest increase to ₹61,709 crore in 2024–25, compared to ₹60,523.89 crore in the previous year, reflecting stable global demand and supply resilience.
B. Energy and Power -
Electricity Generation and Supply -
Key Highlights:
Sharp Rise in Electricity Generation: Electricity generation surged to 44,549 crore units in Q1 2025, up significantly from 31,300 crore units in Q4 2024, indicating strong seasonal demand and improved supply.
Stable Capacity, Slight Dip in Peak Demand Met: While total installed capacity marginally increased to 4,76,000 MW (as of June 2025), the peak power demand met saw a slight decline to 2,30,993 MW in May 2025, from 2,35,200 MW in April 2025, suggesting temporary demand moderation.
Reduction In Energy Shortage: As of April 2025, the power deficit has been reduced to just 0.1%, a dramatic improvement from 4.2% in 2013–14. It marks a significant milestone toward ensuring 24x7 electricity for all and strengthening energy security across the country.
Coal -
Key Highlights:
Sharp Rise in Coal Production and Dispatch: Coal production surged by 17.3% in May 2025 to 164.3 lakh tonnes, while dispatch increased by 4.0% to 174.9 lakh tonnes, reflecting strong supply and demand momentum.
Slight Drop in Pithead Stock: Pithead coal stock declined by 2.4% to 1,226.9 lakh tonnes as of 31 May 2025, indicating higher consumption likely driven by increased power generation.
New and Renewable Energy -
Key Highlights:
Dip in Renewable Generation and Capacity: Renewable power generation declined by 7.6% in May 2025 to 2,202.8 crore units (from 2,384.6 in April), while installed renewable capacity saw a 2.8% drop to 1,707 MW, indicating a temporary slowdown in output and additions.
Strong Uptake in Solar Pump Installations under PM-KUSUM: The number of solar pumps installed under PM-KUSUM rose by 29.5% to 7,00,000 in 2024–25, up from 5,40,500 in 2023–24, reflecting sustained momentum in solar-based agricultural electrification.
C. Manufacturing and Industrial Production :
Steel -
Key Highlights:
Strong Domestic Growth: In Q1 2025, steel production rose by 5% to 1,380 lakh tonnes, while consumption jumped by 11.3% to 1,378 lakh tonnes, indicating robust domestic demand and industrial activity.
Sharp Decline in Exports: Steel exports dropped by 33.3% to 440 lakh tonnes in Q1 2025 (from 660 lakh tonnes in Q1 2024), reflecting a shift toward meeting domestic demand or weaker global competitiveness.
Cement -
Key Highlights:
Dip in Monthly Production: Cement production declined by 3.4% in May 2025 to 385.4 lakh tonnes, down from 398.8 lakh tonnes in April, indicating a temporary slowdown in construction activity or seasonal factors.
Significant Capacity Expansion: Despite the production dip, installed capacity rose sharply by 24.8% to 6,900 lakh tonnes per annum in May 2025 (from 5,530 in April), pointing to strong long-term growth expectations in the sector.
MSMEs -
Key Highlights:
Strong MSME Growth with Rising Credit, Exports, and Formalisation: Credit disbursed to MSMEs grew by 13.5% to ₹ 35.2 lakh crore (March 2025), while exports surged 47.5% to ₹ 12.39 lakh crore in 2024–25. Simultaneously, Udyam registrations rose by 36.6% to 6.5 crore (as of June 2025), reflecting greater formalisation and a thriving MSME ecosystem.
PMEGP Boosts Micro-Enterprise and Job Creation: Under PMEGP, KVIC disbursed ₹300 crore in subsidies to 11,480 service-sector beneficiaries, facilitating ₹ 906 crore in loans. Cumulatively, the scheme has supported over 10.18 lakh micro-enterprises, generating 90 lakh jobs through ₹ 73,348 crore in loans and ₹ 27,166 crore in subsidies, with major allocations to the South (₹ 116 crore) and Central (₹ 72 crore) zones.
D. Infrastructure and Construction -
Key Highlights:
Dip in Highway Construction Activity: National highway construction declined by 15.5% to 5,614 km in 2024–25, compared to 6,644 km in 2023–24, indicating a temporary slowdown in execution pace.
Slight Decline in Toll Revenue: Toll collection dropped by 5.1% to ₹ 61,500 crore in 2024–25, down from ₹ 64,810 crore in 2023–24, possibly reflecting reduced traffic volumes or revised toll structures.
V. Key Takeaways from This Month's Data:
Robust Economic Expansion: India's GDP surged by 7.4% in Q4 FY 2024-25, marking it the fastest-growing major global economy. This impressive growth was primarily propelled by strong performances in the construction and agriculture sectors, showcasing the effectiveness of sustained public infrastructure spending.
Significant Inflation Moderation: Both the Consumer Price Index (CPI) and Wholesale Price Index (WPI) saw considerable cooling, with food inflation plummeting to just 0.99%. This reduction in price pressures offers the government greater fiscal flexibility for investments and provides the Reserve Bank of India with potential room to ease monetary policy.
Strengthening External Sector Dynamics: The nation observed a narrowed merchandise trade deficit and a robust contribution from services exports, significantly improving the overall trade balance. This performance underscores India's growing competitiveness in key sectors and its ability to manage external accounts amidst global challenges.
Favorable Financial Conditions: Declining 10-year G-Sec yields and phased reductions in the RBI Repo Rate to 5.5% signal an easing monetary environment. These conditions are set to lower borrowing costs across the economy, stimulating investment and consumption, which are vital for sustained growth.
Impressive Fiscal Health with Surging Collections: GST collections reached a remarkable ₹2.01 lakh crores in May 2025, representing a significant 16.4% year-on-year increase. This surge not only reflects vigorous economic activity and improved compliance but also provides the government with substantial fiscal headroom for future capital expenditure and development initiatives.
Strong Performance in Agriculture and Allied Sectors: Agricultural production increased by over 216.6 LMT, accompanied by a rise in MSP procurement volumes, indicating effective agricultural policies and robust harvests. Additionally, the fisheries sector showed remarkable transformation, with fish production tripling and India becoming the world's second-largest producer, largely driven by inland fisheries growth.
Energy Security and Transition: Increased domestic coal production and stock levels affirm coal's critical role in ensuring reliable power supply during peak demand periods, simultaneously reducing import dependency. Parallelly, the surge in solar and other renewable energy capacities highlights India's accelerated transition towards a greener grid, significantly contributing to CO₂ emissions reduction and energy trade balance improvement.
Industrial Momentum and Infrastructure Push: India achieved record highs in crude steel production and domestic consumption in 2024–25, signaling strong industrial activity. The cement sector also projects robust growth, fueled by real estate and substantial government infrastructure investments. Furthermore, the national highway network continues its rapid expansion, demonstrating significant progress in connectivity despite facing execution challenges in some projects.
MSME Sector as a Growth Catalyst: The Micro, Small, and Medium Enterprises (MSME) sector continues its robust growth trajectory, marked by a significant increase in credit disbursement and exports, alongside a rise in formal Udyam registrations. This thriving ecosystem underscores the MSMEs' crucial role in job creation and overall economic vitality.
This month's edition of The India Economic Compass clearly illustrates the nation's exceptional economic resilience and dynamic growth trajectory. With inflation largely under control, a stable external sector, and robust performance across critical sectors, the foundations for sustained progress are undeniably strong. While navigating persistent global economic uncertainties and addressing specific domestic execution challenges will remain pivotal, the overall outlook for India remains overwhelmingly positive. Through these strategic advancements, India continues to solidify its pivotal position as a major driver of global economic growth and a beacon of stability in the international landscape.